A dashboard is an information management tool, which can be used for tracking, analyzing, and displaying important performance indicators, metrics, and data points. A dashboard can be used to keep track of the overall health of your company, department, or process, and can be accessed by the paid customer.
- The dashboard gives us the visual statistics of ROI.
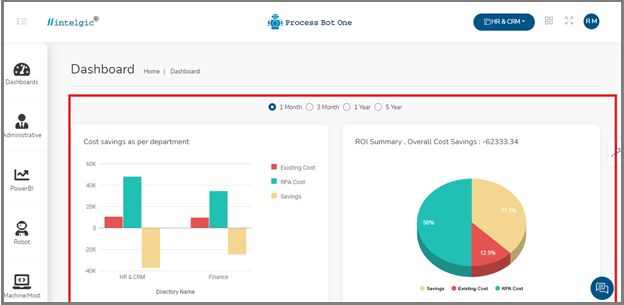
- The dashboard looks like as shown below, it shows the cost savings as per department for one month and an ROI summary of the overall process of the organization.
- In the beginning, the cost savings will be 0, as your RPA starts performing, the cost-saving will also be increased.
- Once you start implementation using RPA, you will start receiving ROI(Return on Invest).
- You are also able to analyze the overall ROI summary of your organization.
- ROI Summary: Return on investment (ROI) is a performance metric that can be used to assess an investment’s efficiency or profitability, as well as to compare the efficiency of several distinct investments. The return on investment (ROI) aims to directly evaluate the amount of profit made on a given investment about its cost.
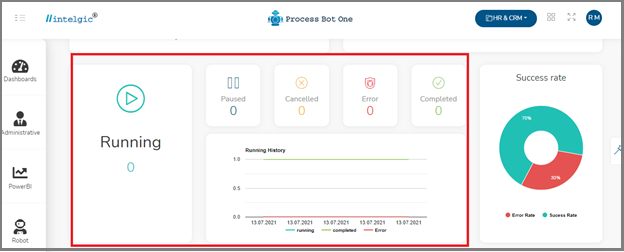
- If you scroll down the dashboard, you can see the real-time parameters of robots like, how many robots are running, how many robots are paused, and how many robots are completed, and how many robots got errors, which is as shown in the below image.
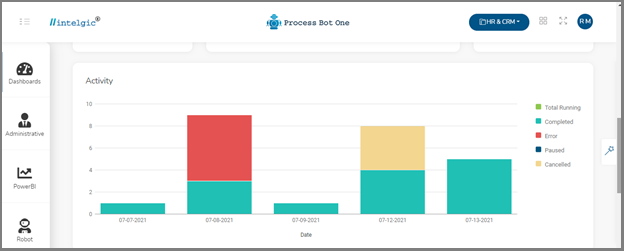
- If you again scroll down a little bit you can see the graph of day-to-day activity, which is as shown in the below image.
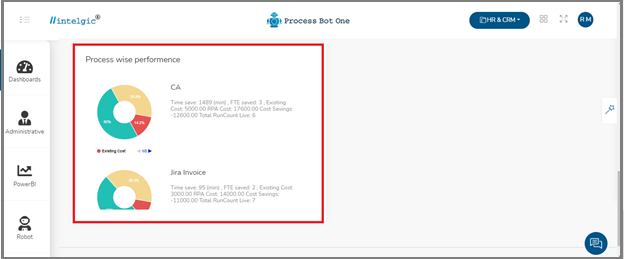
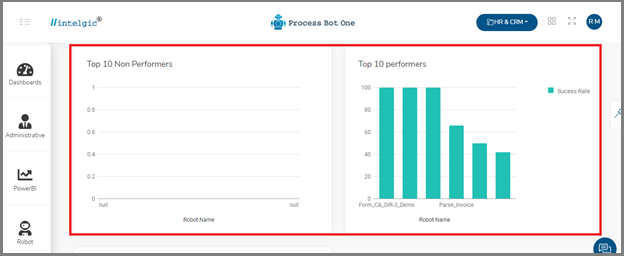
- The dashboard also shows you the top 10 best performing robots and non-performing robots in the graph format.
- Process Bot One also provides us the statics for digital worker vise, If you scroll down to the bottom of the dashboard, you can see the Process vise configuration of digital workers.